
My Team Views
This function provides the ability to view data in different layouts, and to save those layouts.
Information displayed can be sorted by most headings.
This is the original view:

- An optional step is to display a number of entries per page - choose from All, 10 or 20.
- Next you select the type of data you want to report on:

- When you select a data type, e.g. Leave Requests, the My View option will automatically show Default View.
Click to display this view.
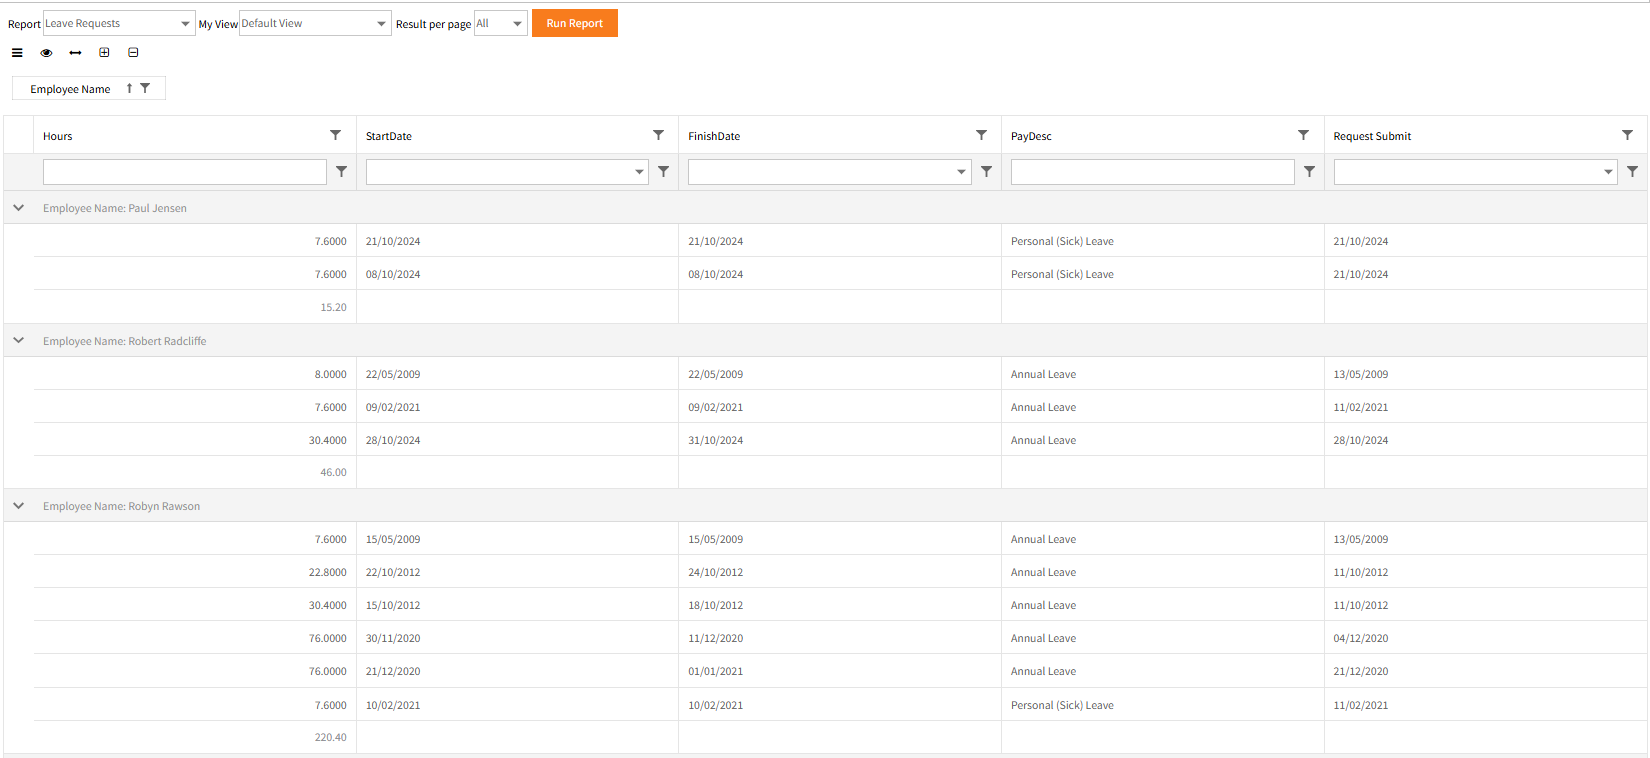
- In this Default View the data has been grouped on the Employee field.
Additional fields can be added to the grouping area, if required.
See Column Grouping for more information. -
Some views, such as Leave Requests allows double-clicking of a result to open a window containing more details (the View Details icon
 does the same).
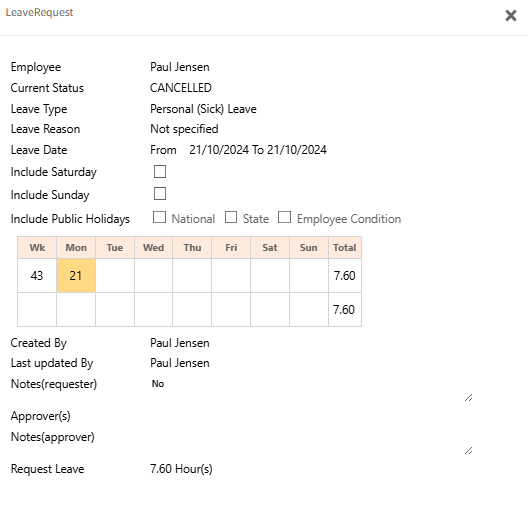
Menu Bar icons
There are 5 icons in My team Views:
| Button | Explanation |
|---|---|
 Menu Menu |
The Menu icon contains Customize fields, Save current layout, Export Results To (xls, rtf, csv) and Print options. |
|
View Details |
This icon is only functional for some views, such as Leave Requests. It can open a pop-up window for a selected result providing more detailed information (same as double-clicking) |
 Fit to screen Fit to screen |
Use this to fit the results to screen and to balance out column widths equally. |
 Expand All Rows Expand All Rows |
When there are multiple rows of data under a heading - e.g. multiple occurrences of annual leave listed per employee - this will expand all these rows. |
 Collapse All Rows Collapse All Rows |
When multiple rows are displayed, this will collapse the display back to the heading level. |
Search on Existing Entries
The filter icon in each field heading can be used to filter the report on values on the report.

Filter on Specific Criteria
Another filter button is available next to a blank box beneath each field heading on a report.
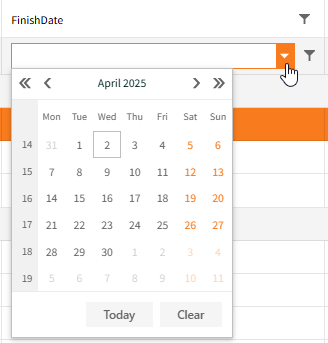
This allows a more configurable filter to be applied than the one available in the heading. For example:

The date may be selected by clicking the down arrow and selecting from the calendar or by typing it in the blank box:

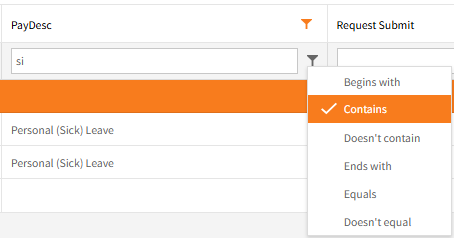
To use the filter, first type appropriate criteria in the blank box, click the Filter icon and select the filter type to use.
For example, type si into the PayDesc field’s blank box, click the Filter icon and select Contains from the Filter options:
In this example the filtered results are displayed automatically, however with searches may need  to be clicked to redisplay the filtered search results.
Customize Fields
Before a report is run, the Grouping and Column heading bars are visible.
![]()
These may populate when a report is run.
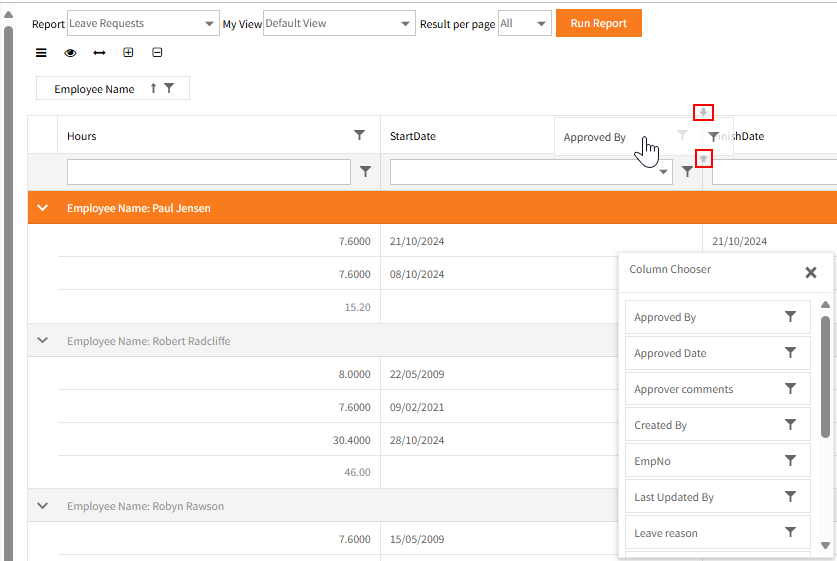
Customize fields, available from the Menu  allows fields to be dragged from the Column Chooser into the Grouping or Column heading bars.
For example, dragging Approved By from the Column Chooser into the Column heading bar.
It will display down and up arrows or left and right arrows (if placed above or beneath) to show where it will be inserted into the view when dropped:
Create a custom view
The Default View displays all the preset columns of data, with no specified criteria, for the data type you have chosen.
Each report will have its own Default View.
It is possible to create custom view sets for reports with required criteria, that can be quickly recalled at any time.
This is similar to generating a custom view in Ready Pay's Data Explorer.
To create a custom view you can use the options Search on Existing Entriesand Filter on Specific Criteria, as well as the Customize Fieldsoption in the .
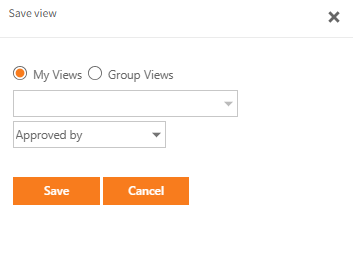
Once you have created the view you want, select Save current layout from the Menu, give the view an appropriate name and click Save.
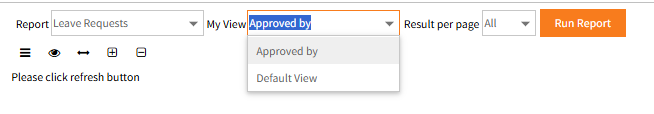
When the appropriate report is selected, your saved view can be selected in My View.
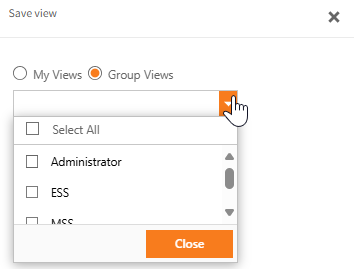
A member of the Employee Self-Service Kiosk Administrator group is also able to select the Group Views option to publish a saved view to Employee Self-Service Kiosk Groups.
All users of the selected groups may choose that saved view for an accessible Report in My Team Views.
Return to My Team